- Home
- News
- What’s On
- Activities for Children
- Arts & Crafts
- Autos and Bikes
- Business events
- Car Boot & Auctions
- Charity events
- Churches & Religious
- Comedy
- Dance
- Days out & Local interest
- Education
- Exhibition
- Film
- Gardening & Horticulture
- Health
- Markets & Fairs
- Music
- Nature & Environment
- Spiritual
- Sport
- Talks and Discussions
- Theatre and Drama
- Business
- Local Information
- Jobs
- Deaths
- Charity events
- Contact Us
Cheshire pollution highlighted
The National Atmospheric Emissions Inventory (NAEI) tracks pollutants in the UK – presenting data via maps showing levels of Carbon Dioxide levels in Cheshire – https://naei.beis.gov.uk.
One of the biggest pollutants on the planet, carbon emissions come from the burning of fossil fuels (such as coal and oil) and natural gas.
To secure the data, Ricardo Energy & Environment collect and analyse information from sources including national energy statistics and data from industrial plants.
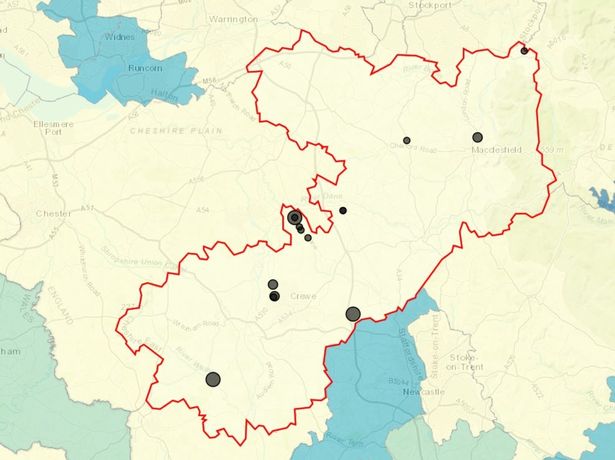
Their interactive CO2 map, using 2018 data, highlights details of Cheshire pollution.
Areas in dark blue have less than 466 kilotonnes of CO2 emissions, areas in light blue between 466 and 650, areas in teal between 650 and 832 kilotonnes and areas in green between 832 and 1,151.
The most polluted areas are shown in beige – with than 1,151 kilotonnes of CO2 emissions.
According to the NAEI map, Cheshire West and Chester has a total of 3,620 kilotonnes of CO2 emissions.
The majority of this pollution, a total of 1,274, comes from large industrial installations, whilst diesel railways makes up the smallest amount, at 10 kilotonnes.
Cheshire East
Cheshire East has lower levels with 2,589 kilotonnes.
Motorways make up the biggest portion, generating 516 kilotonnes.
Diesel railways make up the smallest amount in the county, with 18 kilotonnes – eight more than Cheshire West and Chester.
Industrial installations with high emissions are scattered across the county.
Brooks Lane Industrial Estate, just south of Middlewich, is one of the larger industrial installations on the map, with a scattering of other installations on Booth Lane which leads into Middlewich.
Meanwhile, a large industrial installation can be found at Radway Green, near Crewe Road just outside of Alsager.
A spokesperson for NAEI said: “The estimates calculated by the national atmospheric emission inventory help to provide a picture of the important sources and trends in emissions and removals and to focus action to improve our local national and global environment.
“This data is used for a number of purposes including the provision of information to track the UK’s progress towards international commitments on greenhouse gases (climate change) and harmful air pollutants (air pollution).”
You must be logged in to post a comment Login