- Home
- News
- What’s On
- Activities for Children
- Arts & Crafts
- Autos and Bikes
- Business events
- Car Boot & Auctions
- Charity events
- Churches & Religious
- Comedy
- Dance
- Days out & Local interest
- Education
- Exhibition
- Film
- Gardening & Horticulture
- Health
- Markets & Fairs
- Music
- Nature & Environment
- Spiritual
- Sport
- Talks and Discussions
- Theatre and Drama
- Business
- Local Information
- Jobs
- Deaths
- Charity events
- Contact Us
Latest COVID-19 figures for Cheshire East

These are the most recent data from the Cheshire and Merseyside Directors of Public Health 7 and 14 day daily dashboard.
Using data from 8 January 2021, there have been:
- 1670 cases in the previous 7 days
- 1658 cases in the prior 7 days (up to 1 January)
- 435 cases per 100,000 population in the previous 7 days
- 607 cases in England per 100,000 in the previous 7 days
The current estimate for the R number in the North West is 0.9 – 1.1. This means that, on average, 10 infected people will transmit the infection to 9 to 11 other people. It isn’t possible to measure the R number directly, so various information sources are used to estimate it. We show estimates at the regional level here as we have more confidence in them than estimates for smaller geographical areas such as Cheshire East. For a detailed description of what the R number means and how it is calculated see the government guidance page.
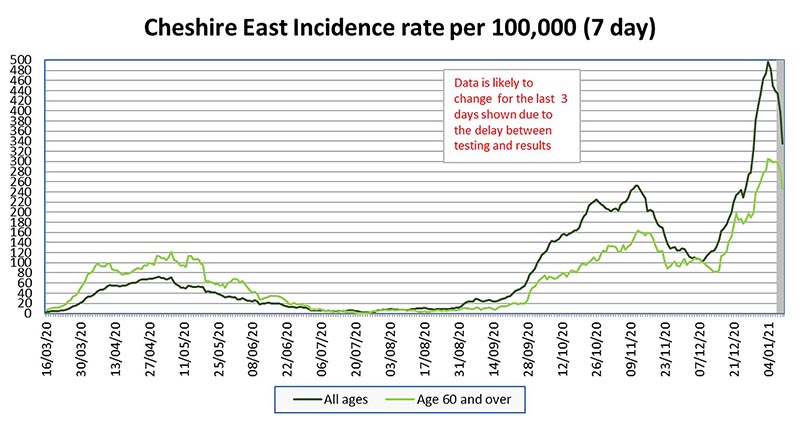
You can see the incidence rate of COVID-19 cases in the graph, based on the date of specimen. After a decrease in the rate of cases since early November, it appears from the last few weeks that the rate is increasing.
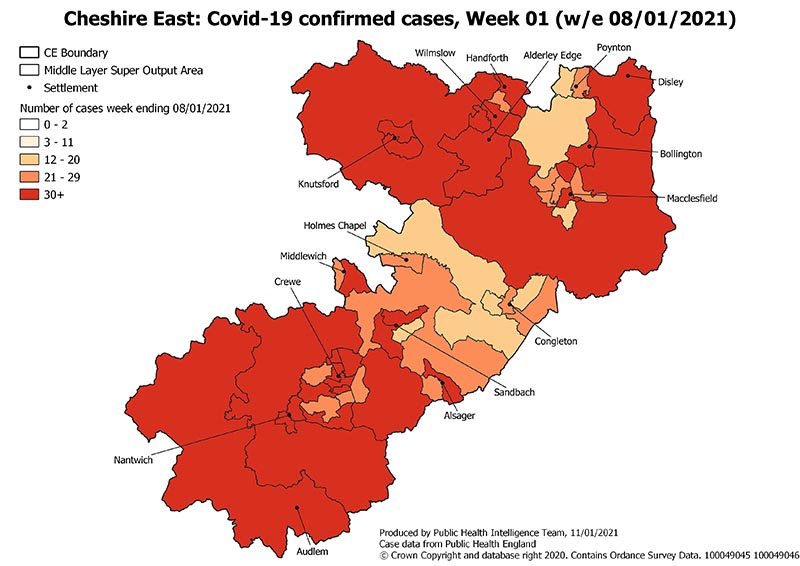
The number of confirmed COVID-19 cases in the most recent week can be shown in the map below. There is also an interactive map showing the number and rate of cases in your local area, you can search this using your postcode to see the situation in your local area.
Public Health England has updated the way it records the location of people when tested. It now allocates a person to a Local Authority by the address they give at the point of testing. Previously it allocated a person using the address on a patient’s NHS Summary Care Record. This change particularly affects students who are studying in a different Local Authority than their home address on their GP records. This change has been retrospectively applied to all tests carried out from the 1 September 2020.
You must be logged in to post a comment Login